
Poorest Countries in Europe are not necessarily countries where people live in the most difficult conditions, and the answer changes depending on how poverty is measured. The latest comparable European Union figures show that Bulgaria and Greece had the lowest GDP per person in the EU in 2025 when differences in prices between countries are taken into account, while Latvia followed closely behind.
That distinction matters because simply converting national economies into US dollars or euros does not tell the whole story. A euro buys different amounts in Sofia, Athens, Helsinki or Luxembourg. Economists therefore often use purchasing power standards, or PPS, when comparing GDP per person across European countries. The measure adjusts for differences in price levels and sets the EU average at 100.

On that basis, Bulgaria recorded a GDP per capita index of 68.1 in 2025, while Greece stood at 68.4. Latvia was at about 71. These were the lowest figures among the EU’s 27 member states. The EU average was equivalent to about EUR 41,620 in purchasing power terms.
Bulgaria’s position at the bottom of the EU comparison is not new. The country also recorded the lowest GDP per capita in the EU in 2024, at 66% of the EU average. Greece moved into the same position in 2025 after its index reached roughly 68% of the bloc-wide average.
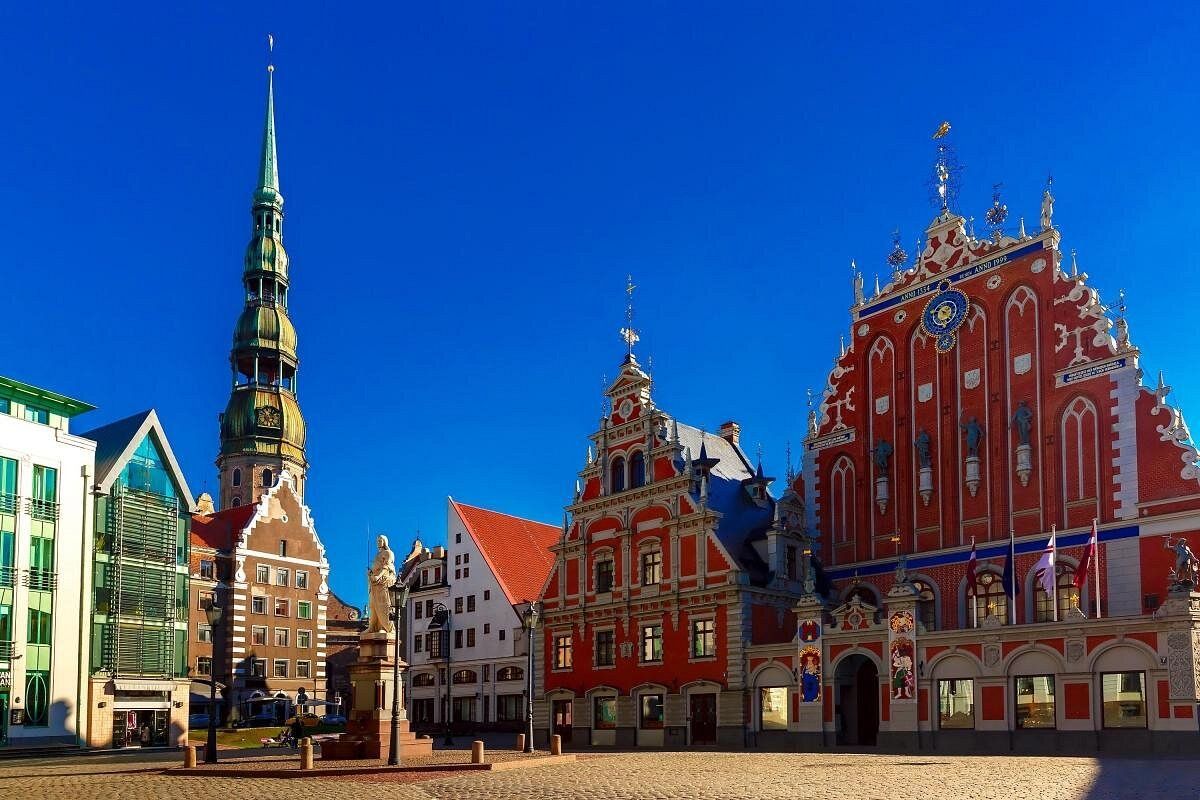
Latvia’s figure was higher than those of Bulgaria and Greece but still substantially below the European Union average. Other countries towards the lower end of the EU scale included Croatia, Romania, Hungary and Slovakia, although their positions were not as low as those of the three countries at the bottom. Eurostat’s 2025 data put Croatia and Romania at around 78% of the EU average, Hungary at 76% and Slovakia at 75%.
The figures become more complicated when the definition of Europe is expanded beyond the European Union. Countries such as Moldova, Ukraine, Kosovo, North Macedonia, Bosnia and Herzegovina and Albania have lower GDP per person than many EU members when measured in current US dollars. World Bank data for 2025, for example, put GDP per capita at about $8,622 in Moldova, $5,866 in Ukraine, $7,899 in Kosovo, $10,382 in Bosnia and Herzegovina, $10,490 in North Macedonia and $12,998 in Albania.

Those numbers should not be placed directly beside Eurostat’s PPS figures as if they were the same measurement. Current-dollar GDP is affected by exchange rates and local prices, while PPS is designed to make cross-country comparisons of purchasing power more meaningful. The difference is one reason there is no single universally accepted list of the poorest countries in Europe.
Moldova is a useful example of why the question needs some care. The World Bank recorded its 2025 GDP per capita at about $8,622 in current US dollars, compared with nearly $13,000 in Albania. But those figures alone do not show how much households can actually buy in each country. A comparison based on purchasing power can produce a different picture because the cost of goods and services varies considerably between economies.

GDP itself also has limits as a measure of living standards. It measures economic output, not household wealth or the amount of money an average person has available to spend. Eurostat specifically cautions that GDP per capita can differ from measures of household material welfare. Foreign-owned companies can generate substantial economic output in a country while some of the resulting income is transferred abroad. Cross-border workers can also contribute to the GDP of the country where they work while being counted in the population of the country where they live.
For that reason, another Eurostat measure, actual individual consumption, can provide additional context. It is intended to capture the goods and services actually consumed by households, including those provided or paid for by government and non-profit organisations. In 2025, Eurostat found that differences in household material welfare were smaller than differences in GDP per capita across EU countries, although significant gaps remained. Hungary and Latvia recorded the lowest levels of actual individual consumption per person in the EU.
The wider European picture also reflects the continent’s uneven economic development. Western and northern European economies generally sit much higher on measures of output per person, while several countries in southeastern and eastern Europe remain below the EU average. Yet the gap has narrowed in some parts of the continent over the longer term as economies have integrated more closely with European markets and benefited from investment, trade and EU membership.
The EU figures also show just how large the range can be. Luxembourg recorded a GDP per capita index of 238.7 in 2025, followed by Ireland at 237.3. The Netherlands stood at 134, Denmark at 127, Austria at 117 and Germany and Belgium at 115. Finland was just above the EU average at 101.

Luxembourg’s exceptionally high figure also illustrates why rankings need context. The country’s economy benefits from a large number of people who work there but live across its borders. Those workers contribute to Luxembourg’s GDP, while their resident populations are recorded elsewhere. Ireland’s unusually high GDP per capita has its own statistical complexities, including the role of multinational companies in the country’s economy.
Calling a country one of the “poorest countries in Europe” therefore tells only part of the story. Bulgaria’s position at the bottom of the EU’s 2025 GDP-per-capita comparison is a clear statistical finding, but it does not mean every Bulgarian household is poorer than every household elsewhere in Europe. Nor does a country’s GDP ranking explain differences in wages, housing costs, employment, inequality, public services or household wealth.
What the data does show is a persistent economic divide across Europe. Bulgaria and Greece were the EU’s lowest-ranking countries on GDP per capita in purchasing power terms in 2025, with Latvia next. Beyond the EU, countries such as Moldova, Ukraine and Kosovo recorded much lower GDP per person in current-dollar terms, but comparing them with EU members requires the same methodology to be used across the entire group.
The most useful way to understand the poorest countries in Europe is therefore not to treat the label as a simple league table. It is to look at what is being measured, whether prices have been adjusted, and whether the statistic describes national economic output or household living standards. The latest figures make the economic gap across Europe clear, but they also show why one number can never fully describe how people live.